According to the data on
this page this is the 4-th lowest close. Interesting is what happens after that. As I wrote this weekend because of the very low VIX levels SP500 should be in wave iv of 3 since Feb.2016 and the bigger correction should come later... history seems to confirm this.
The same data from the page above by date:
Date --- Close
22 December 1993 --- 9.31
23 December 1993 --- 9.48
27 December 1993 --- 9.70
28 December 1993 --- 9.82
28 January 1994 --- 9.94
What happened after that -> small pullback -> 6% higher for 4 weeks -> 11% lower for 9 weeks
20 November 2006 --- 9.97
21 November 2006 --- 9.90
14 December 2006 --- 9.97
24 January 2007 --- 9.89
What happened after that -> small pullback(after every record low) -> 6% higher for 11 weeks(after the first record low) -> 7% lower for 4 weeks
What is common - after a record low small pullback follows, move higher roughly 6% and then bigger correction. The difference - in 1993 the move 6% higher was short 4 weeks and the correction long 11 weeks, in 2006 it was the opposite.
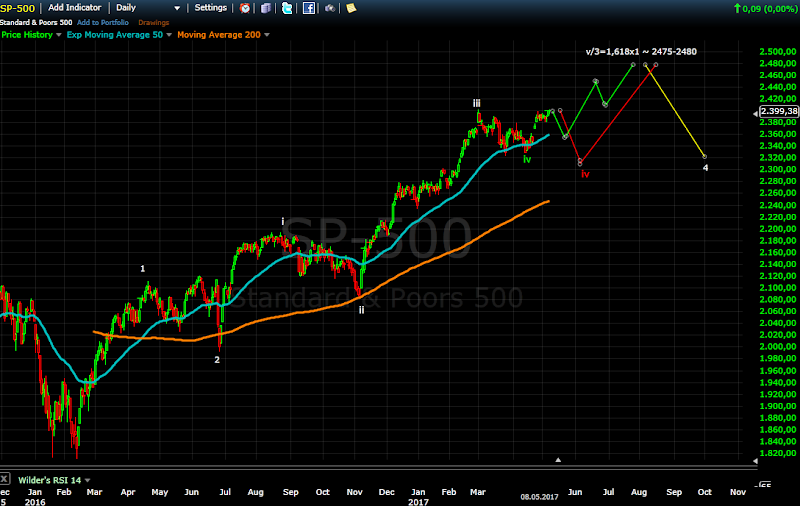
Now if we translate this in the current pattern:
- two options for the small drop - could be roughly 50 points (ii) of v of 3 to close the gap and test MA50(green pattern) or 80-90 points to 2310-2320 for expanded flat and finished iv of 3(red pattern).
- move higher for v of 3 - this is the 6% move higher... from 1320 to 1480(3=1,618x1) is again like in 1993/1994 and 2006/2007 roughly 6%:))))
- the bigger correction will be wave 4.
You know my preferred scenario - this is red. Cycles will fit like a glove - another 2-3 weeks lower for 17-18 weeks long 20 week cycle. Wave 4 for the 18 month cycle low it will stretch way too long and with a low behind us the 40 week cycle will be way too short. As I wrote weeks ago after long 40 week cycle(38 weeks) a shorter one follows according history since 2009 25-31 weeks long. With a low in 2-3 weeks we will have 28-29 weeks long 40 week cycle and 18 month cycle with average length as expected.
VIX 1993-1994. Short rally , the index with higher high VIX with higher low and divergence.
VIX 2006-2007. Slow rally crawling higher for almost three months and sharp decline.
VIX 2017 before a major top we will see a higher low and a break out from the wedge.


Thanks alot.. good analyze and good catch
ReplyDeleteThank you for your insight analysis, very helpful indeed. I have one question regarding convergence of major cycles at the approaching top, mainly supercycle and grand supercycle. I noticed there are some disagreements as some believe the top of supercycle was in 2000 and now with this rally we have started a new leg of the new one. Others say that the year 2000 was beginning of wave 4 of the supercycle as well as grand supercycle with this rally being the 5th leg. If this is true then major disaster and mayhem is just around the corner, much worse than 2008 crisis. I am very curious what your prognosis is on the approaching bear. Thank you.
ReplyDeleteKrisarnold
Such counts are pure speculation. It will be too late to know if you are right or wrong and you can not trade them anyway.... so I do not try to analyze the next 50 years.
DeletePersonal opinion - 8 years look too short for grand super cycle wave. I do not think DJ will fall to 400... worst case cyclical bear and bull markets going nowhere for decades. If DJ drops to 400 with very high probability we will not sit in front of a PC and trading anyway.
EW should be used step by step, guessing a few steps ahead is not useful. First to see the top, then the move lower in 2019 if it is corrective or impulse and so on. A trader should be short anyway, if it is mayhem...so be it.
Thanks for the feedback Krasi. I did not mean to sound so over pessimistic.. I was more thinking of DJ testing 2009 lows and I hope that level holds if such a downtrend takes over. To me this would be a mayhem, imagine 15000 drop. But when I look at most major indexes around the world most of them have not reached their highs from 2007 yet, exception is USA, DaX and Ftse. All world index has just touched the all time high at the time of matured or maturing economic expansion. That alone makes me think that if the turn happens soon we may revisit 2009 lows and start bouncing around between 2007 highs and those lows for some time to come. Anyways just wanted to share this longer term view. Thanks Krasi for your work.
DeleteKrisarnold
Ok I have read forecast for levels much lower than 2009. I do not think this will happen. Worst case if we have a grand super cycle high decades sideway move between 2009 low and current highs going nowhere in nominal values and making lower lows adjusted for inflation... until the system is repaired.
DeleteTo be honest for the next major low 2022-2023 I do not think the indexes will test the 2009 low so I do not expect something like 15k drop for several years. I think between now and 2030 we will have sharp cyclical bull and bear markets up and down lasting several years... something like the 70ths. On very long term scale 150 years chart it will look insignificant you will not even notice it, but if you hold stocks it will feel devastating... for example SP500 makes a top somewhere between 2500-3000 and test support 1500 this is 40%-50% loss for 2-3-4 years, then it retraces at least 38% Fibo from 1500 to 2000-2200 this is again 30%-40% gains for 2-3 years... and so on
Well it seems you will nail USDJPY june/july top from your long term analysis. Congratulations.
ReplyDeleteThe big picture is becoming clearer:
-stocks as mentioned above
-usdjpy top early summer then lower high around november when stocks peak
-Metals rallying from july
What's your view on GDXJ? Miners don't seem to sell off violently any more. In fact they hang on pretty good. Small rally from here and some kind of double bottom in June or lower?
PM are playing catch up, before that miners were hit hard. Yes, they hang pretty good even it is possible that we have a bottom already. What bothers me is exactly USDJPY - strong rally with impulse which means there will be more to the upside, cycles the same story pointing higher to at least late June before a top..... which means no strong rally for PM most likely for miners too.
DeleteShort said I do not know - at the moment everything is possible higher low,double bottom,lower low.... I need to see more price action to say if we have a bottom and what kind.
As a trader at such moments it is time to make a decision which is different for everyone.
A guy wrote GDXJ is close to support buy it and wait...
You can build a position buying small portions...
Personally I have decided until June to see what happens.
How about current short term trend? GDXJ looks like some shooting star from daily charts... Short term correction next Monday? Thanks. SPX is so weird to show cross in two days... Thanks.
ReplyDeleteGDXJ so far it looks like 1-2-3 so yes at least short term pullback expected.
DeleteSPX is difficult at the moment. I think it will move lower next week and when we see how it moves lower we will know what is going on.
But the gap is not filled at all during today's trading. Candle theory said it's still very bullish... May not sure of Monday Jump up again?
DeleteHi, Krasi, for the future last big wave 5 in your long term chart, which sector do you think would be the strong one to play? To me bio sector is so weak... Maybe PM/miners sector would be strongest? Thanks.
DeleteI did not mean it literally GDXJ on Monday will be lower. The move looks like 1-2-3 so it is time for a pause for wave 4 at least... even this could be the pause.
DeleteThe strongest sector is the tech sector. PM should be making major low at that time so stock should outperform PM.
ReplyDelete