No doubt the price action for precious metals/gold miners is bullish
What we have so far is bullish behavior which points to further gains later this year. To sum up:
– EW - impulse higher, expect more to the upside after a correction.
– Cycles - important low I think it is 4/8 year cycle low followed by bullish right translated 20 week cycle. The move higher last longer compared with max 12 weeks higher for all 20 week cycles since 2011. This move is not part of the decline from 2011.
– market breadth - bullish behavior staying overbought for weeks which happens in a bullish move. This is not typical for bear market. Again this move is not part of the decline from 2011.
With impulse from the bottom, 20 week cycle low expected in Mai and
probable 4 year cycle high this month what are the options:
– bearish – gold reversing and making new lows – I will give 0% probability to this scenario. I see nothing to support it.
– bullish – the move up is wave 1/A, correction lower into Mai for 2/B is expected and continuation higher 3/C. It is possible, but I think this scenario has lower probability and if you are gold bull, you do not want to see this. Vertical moves should appear at the end of a bull market not at the beginning. It is the same reason why I was calling bottoms for stocks in August and February - exhaustion way to early, this is not sustainable.
– the middle way – correction with higher low stretching in time to September-October so that the markets "digest" the vertical move up. I expect after a low in Mai one more 20 week cycle lower with possible higher high for gold miners in June-July.
The last one is my preferred scenario here is why:
1. Higher low because after an impulse the next move is a correction followed by new highs, but I expect the correction to stretch for a few months because of the reasons below.
2. Four year cycle top - see the
post from SilentOne peak to peak cycle analysis for gold. Such a top usually causes move sideway/lower for a few months(see the chart from the post).
3. USD – if my analysis is right we are in a triangle and than we should see final move higher. Gold does not make bottom/top exactly
when USD makes it’s top/bottom, but strong moves start after USD top/bottom.
Look at this chart(Rambus Chartology at Safehaven.com) and compare them. Gold bottomed in 1999 but it really took off after the USD made it’s final top, or the gold bear market begun 2011 when USD started it's move higher. I expect something similar gold bottomed earlier, correction for roughly 5-6 months and precious metals really taking off after the final USD top.
4. Gold majors NEM/ABX begun their move earlier than gold and they are already in a wave three. So after a bottom in Mai for wave 4 we should see higher high for wave 5 probably in June followed by a correction for several months. I can not imagine gold moving higher and majors moving lower. So the pattern for majors is pointing to a low in Mai, but more important low in September-October.
This way we will see majors like NEM/ABX, GDXJ and gold synchronizing their bottoms and blasting higher for the next wave up.
Maybe it sounds complicating, but the trading plan is simple - if you see three waves lower into Mai buy the bottom and we see what happens.If I am wrong we make money, If I am right we will make some profits and reload later in autumn again.
Here are the charts to see how my forecast for the next 6 months should look like:
Gold with the expected path if I am right. Support area around 1150, 50% and 61,8% Fibo retracement at the same levels.
Vertical lines are the 40 day cycle lows. Two 40 day cycles make one 20 week cycle. The first is expected to bottom in the first half of Mai. The second in September-October.

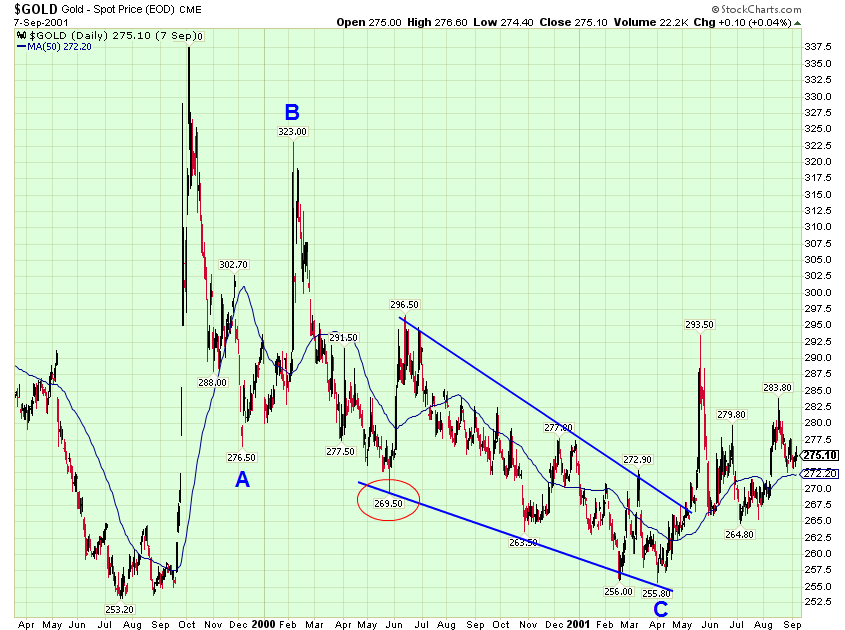
Here is gold 1999-2001 if you do not believe that it can rally for 2-3 months and correct for 18 months with higher low:)
Back then USD was topping for 2 years. This time it should not last so long, but if the USD has one more high a correction A-B-C(to the red circle) for roughly 6 months is in the cards.
I am following this triangle for a few months and if it plays out we should see it finished in the first half of July.
The vertical lines again are 40 day cycle lows and we have four 20 week cycles. A finished triangle will be a 18 month cycle low and final rally for the USD should start.
This is one of the majors NEM, ABX has the same chart. If the count is right we should see more important low in September-October
And GDXJ - if major gold miners make higher high, I am speculating that junior miners will make higher high too, but as a part of a bigger correction.


No comments:
Post a Comment